Distributed tracing has already established itself pretty well as a powerful observability tool for microservices and distributed systems, but it shines even beyond those domains, in my opinion. Adding tracing to areas like CI/CD, local tools, and even compilers can give incredible insights.
There isn't anything really stopping these areas from tracing for the most part, other than its less common. But one common thing outside of services is shell scripting. Even shell scripts can do tracing though!
In this post, we will cover a variety of ways to emit traces from shell scripts. All of these examples build upon the otel-cli tool, which is a simple CLI tool that can send trace spans.
Simple tool usage
For very simple usages, otel-cli shines out of the box. Lifting an example from their docs:
# Run a trace receiver. You can also use anything else that handles OTLP, such as Jaeger - this is just a simple demo server.
$ otel-cli server tui &
# configure otel-cli to talk the the local server spawned above
$ export OTEL_EXPORTER_OTLP_ENDPOINT=localhost:4317

# run a program inside a span
$ otel-cli exec --service my-service --name "curl google" curl https://google.com

# The `server tui` now shows our trace:
Trace ID                         | Span ID          | Parent | Name        | Kind   | Start | End | Elapsed
ddb111b10d617f4b7d7f9ac92ba5687c | f35df40a78a4d9a3 |        | curl google | client | 0     | 134 | 134
This is great for simple usages, but degrades when we want to do things like use shell functions, deeply nest calls, etc. There are a few more advanced examples provided, but they didn't exactly fit my needs, so I explored some alternatives.
Caller explicitly tracing
For a bit more advanced usage, we can essentially replicate otel-cli exec as a bash function.
First, we will need to generate a new span ID and use the parent's trace ID if it is present.
Finally, we just execute the command and report the span with the time spent.
function tracing::run() {
  # Throughout, "local" usage is critical to avoid nested calls overwriting things
  local start="$(date -u +%s.%N)"
  # First, get a trace and span ID. We need to get one now so we can propagate it to the child
  # Get trace ID from TRACEPARENT, if present
  local tid="$(<<<${TRACEPARENT:-} cut -d- -f2)"
  tid="${tid:-"$(tr -dc 'a-f0-9' < /dev/urandom | head -c 32)"}"
  # Always generate a new span ID
  local sid="$(tr -dc 'a-f0-9' < /dev/urandom | head -c 16)"

  # Execute the command they wanted with the propagation through TRACEPARENT
  TRACEPARENT="00-${tid}-${sid}-01" "${@:2}"

  local end="$(date -u +%s.%N)"

  # Now report this span. We override the IDs to the ones we set before.
  # TODO: support attributes
  otel-cli span \
    --service "${BASH_SOURCE[-1]}" \
    --name "$1" \
    --start "$start" \
    --end "$end" \
    --force-trace-id "$tid" \
    --force-span-id "$sid"
}
Usage:
function nested() {
  tracing::run "child1" sleep .1
  tracing::run "child2" sleep .2
  tracing::run "deep" deep
}

function deep() {
  tracing::run "in-deep" sleep .1
}

tracing::run "parent" nested

Decorators
This works fine, but its a bit manual. Each caller needs to initiate the trace. Instead, we may want the function itself to declare it should be traced. This is a common pattern in other languages, but why should Python and Rust get all the fun of decorators? We can do the same in bash!
Just a little eval and we are on our way...
# Usage: tracing::decorate <function>
# Automatically makes a function traced.
function tracing::decorate() {
eval "\
function $1() {
_$(typeset -f "$1")
tracing::run '$1' _$1
}
"
}
All this does is re-define our function, but with a call to tracing::run.
# Original function
function nested() {
  sleep .1
  sleep .2
  deep
}
# Decorate it
tracing::decorate nested
# Now nested() has been redefined:
function nested() {
 function _nested() {
   sleep .1
   sleep .2
   deep
 }
 tracing::run nested _nested
}
Once this is done, I can just call nested as usual and it will be traced.
These two approaches can be used together as well. For example:
function deep() {
  tracing::run "in-deep" sleep .1
}
tracing::decorate deep

deep
Full automated
But other languages have fully automatic instrumentation, you may say. Automatically rewriting my shell scripts is surely a good idea.
If you insist, it can be done... but we will need a few tricks.
Basically our goal is to invoke some code on the start and end of each function.
First, we can use the DEBUG trap, which is invoked on each command execution.
This gives us the first half.
For the second half, we can use the RETURN trap, which is invoked when a function returns.
One caveat is DEBUG runs a lot more often than RETURN; the former is called for every command executed (such as echo), while the latter is only for functions. So we will need to filter our some calls to DEBUG.
Lastly, we need to run set -o functrace to make our traps we setup inherited to functions.
Putting this all together:
function tracing::auto::init() {
  tracing::init
  set -o functrace

  # First, get a trace and span ID. We need to get one now so we can propogate it to the child
  # Get trace ID from TRACEPARENT, if present
  trace="$(<<<${TRACEPARENT:-} cut -d- -f2)"
  trace="${trace:-"$(tr -dc 'a-f0-9' < /dev/urandom | head -c 32)"}"
  spans=()
  starts=()
  oldparents=()
  function tracing::internal::on_debug() {
      # We will get a callback for each operation in the function. We just want it for the function initially entering
      # This is probably not handling recursive calls correctly.
      [[ "${FUNCNAME[1]}" != "$(<<<$BASH_COMMAND cut -d' ' -f1)" ]] && return
      local tp=`tr -dc 'a-f0-9' < /dev/urandom | head -c 16`
      spans+=("$tp")
      starts+=("$(date -u +%s.%N)")
      oldparents+=("${TRACEPARENT:-}")
      TRACEPARENT="00-${trace}-${tp}-01"
  }
  function tracing::internal::on_return() {
      if [[ ${#spans[@]} == 0 ]]; then
        # This happens on the call to tracing::auto::init
        return
      fi
      local tp=""
      if [[ ${#spans[@]} -gt 1 ]]; then
        tp="00-${trace}-${spans[-2]}-01"
      fi
      local span="${spans[-1]}"
      local start="${starts[-1]}"
      local nextparent="${oldparents[-1]}"
      unset spans[-1]
      unset starts[-1]
      unset oldparents[-1]

      TRACEPARENT=$nextparent otel-cli span \
        --service "${BASH_SOURCE[-1]}" \
        --name "${FUNCNAME[1]}" \
        --start "$start" \
        --end "$(date -u +%s.%N)" \
        --force-trace-id "$trace" \
        --force-span-id "$span"
      TRACEPARENT="${nextparent}"
  }

  trap tracing::internal::on_return RETURN
  trap tracing::internal::on_debug DEBUG
}
Unlike in our previous implementations, we need to essentially re-implement the stack to store start times and previous spans through global variables. This likely falls apart in some cases, but for simple cases it works out well.
Once we have the infrastructure in place, all we need to do is call tracing::auto::init and all our functions are automatically instrumented.
We can actually put all three of these techniques together. Here I have a script using the tracing::auto::init, but invoking some other scripts using the manual version, as well as the decorated version.
tracing::auto::init

function nested() {
   tracing::run 'sleepy' sleep .1
   deep
   sleep .1
   deep
}

function deep() {
   deep-deep
   sleep .05
   deep-deep
}

function deep-deep() {
   sleep .1
}

nested
./test.sh
./test-decorate.sh
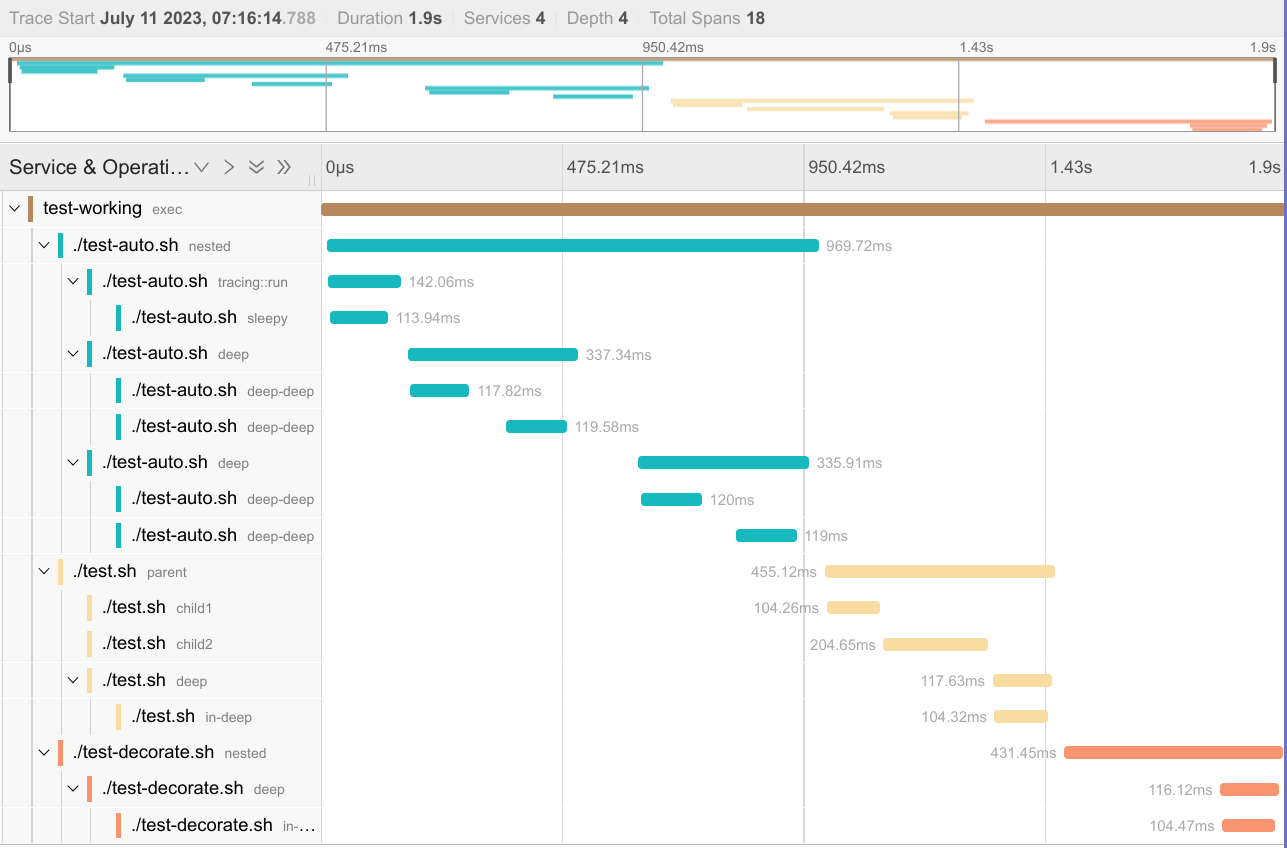
I can even call this with otel-cli exec (which in the real world could be part of a large CI/CD pipeline trace):
otel-cli -s my-pipeline -n test exec -- ./test-auto.sh
And I end up with this nice, full end to end trace:
Wrapping up
The full script with all three methods can be found here.